Three polls in less than 48 hours, three different methodologies and yet, practically the same story.
The Parti Québécois remains in the lead without making any real gains. The Coalition Avenir Québec is losing ground. The Liberal Party remains in the bottom twenty. The Conservative Party is consolidating its position.
At first glance, nothing revolutionary.
But when these figures are translated into constituencies, the picture becomes much more dramatic.
The PQ can now envision a majority with less than 30% of the vote. The CAQ could retain around one in five voters while seeing its parliamentary representation collapse. And the PCQ, which failed to elect anyone with 12.9% of the vote in 2022, could this time transform a slightly larger proportion of the popular vote into a genuine parliamentary delegation.
The most significant change in this campaign may therefore not be happening at the top of the rankings.
It occurs on the map.
Three polls, almost the same picture
The three most recent measures are remarkably consistent.
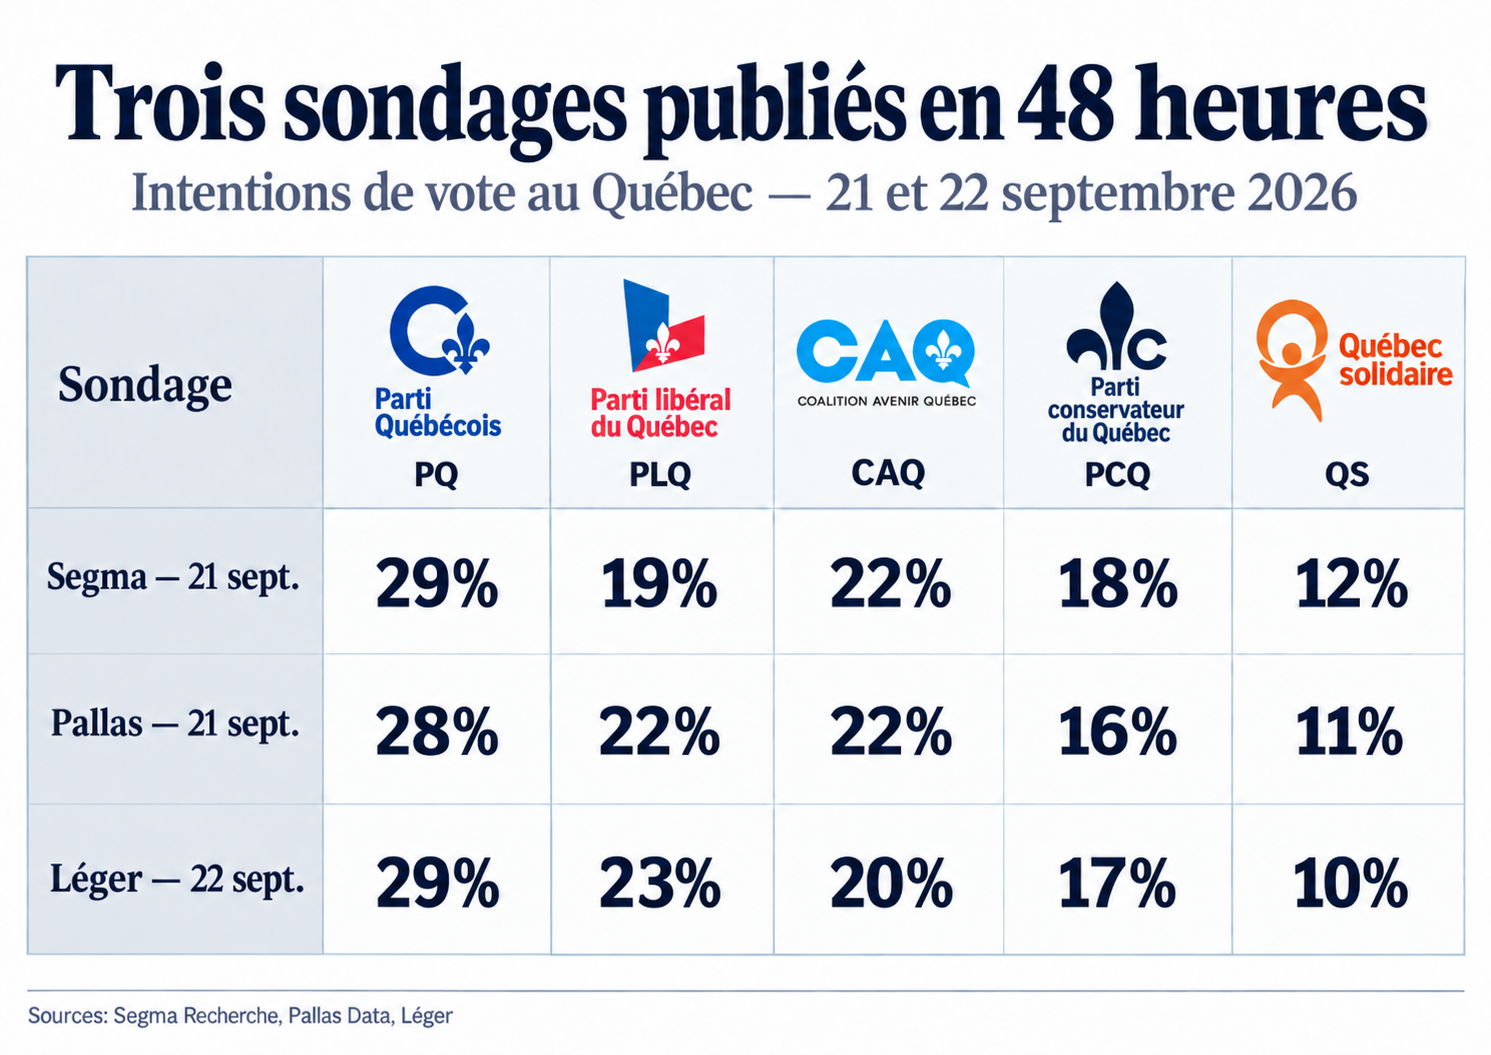
Segma Research places the PQ at 29%, the CAQ at 22%, the PLQ at 19%, the PCQ at 18% and Québec solidaire at 12%.
Pallas Data, in a survey conducted on September 19 among 1,122 adults, gives 28% to the PQ, 22% to the PLQ, 22% to the CAQ, 16% to the PCQ and 11% to QS.
Finally, Léger places the PQ at 29%, the PLQ at 23%, the CAQ at 20%, the PCQ at 17%, and QS at 10%. His poll was conducted from September 18 to 21 among 1,001 Quebec voters.
Discrepancies exist. That's normal. A poll remains a snapshot, not an X-ray of the Quebec soul.
But the overall picture is hard to miss.
The PQ is hovering around 28 or 29%. The PLQ and the CAQ are vying for the lower 20%. The PCQ is holding steady between 16 and 18%. QS is hovering around 10 or 11%.
This is not a wave.
It's a fragmentation.
And in our voting system, this distinction can make all the difference.
The PQ is moving forward without moving forward
This is probably the central paradox of the campaign.
The PQ remains at 29%. It hasn't suddenly captured 35 or 40% of the electorate.
However, his parliamentary situation is improving.
The reason becomes clear when we look beyond the provincial result.
Among Francophones, Léger now places the PQ at 37%, compared to 24% for the CAQ. The PCQ obtains 18%.
In many Francophone ridings, the PQ is therefore benefiting from a weakened CAQ opponent while the PLQ, the PCQ and QS share a good part of the rest.
Qc125 sums up the situation bluntly: with only 29% of voting intentions, the PQ is now "on the verge of a majority", thanks in particular to its strength among Francophones and the division of the vote.
Since the new electoral map, Quebec has 127 ridings. Therefore, 64 ridings are needed to obtain a majority.
Sixty-four seats with potentially fewer than three out of ten voters.
A projection is obviously not an election result. Qc125 combines polls, past results, and demographic data to estimate what would happen if an election were held at the time of the projection.
But the very possibility of such a result shows how much our system can amplify a relatively modest lead.
The PQ does not necessarily need to gain many more voters.
He can simply take advantage of the fact that his opponents are effectively sharing the losses.
The CAQ is now on the wrong side of the slope
The most significant change in recent weeks probably concerns the CAQ.
Segma and Pallas place it at 22%. Léger now measures it at 20%.
Christine Fréchette's personal indicators have also deteriorated.
In the Léger of September 22, Paul St-Pierre Plamondon reached 26% as the leader who would make the best prime minister, up four points, while Christine Fréchette fell to 19%.
Léger also measures a particularly strong desire for change: 65% of Quebecers want a new party to form the government.
The Fréchette effect, which had allowed the CAQ to make a comeback earlier in the campaign, therefore seems to be running out of steam.
But its real problem may not even be its provincial percentage.
That's the distribution of his vote.
Philippe J. Fournier points out that, in the CAQ's current position in his model, each percentage point gained or lost corresponds on average to approximately 6.2 seats. He gives the example of a CAQ finishing at 20% rather than 23%: the difference would represent nearly 19 seats in the projection.
Why such sensitivity?
Because the CAQ is likely to finish second in a large number of ridings.
And our voting system has a brutally simple characteristic: finishing second with 35% of the vote earns exactly the same number of seats as finishing last with 3%.
Zero.
A party can therefore retain a substantial share of the popular vote while seeing its parliamentary representation dwindle much more rapidly than its national result.
The PCQ is finally starting to convert its votes into seats
The opposite phenomenon seems to occur among conservatives.
In 2022, the PCQ obtained 12.9% of the votes without electing a single member of parliament.
His problem wasn't just his level of support.
That was his dispersion.
A party can accumulate 15 or 20% in a multitude of constituencies and win none.
This time, the situation is different.
The PCQ remains at 17% in the latest Léger poll, but reaches 34% in the Quebec City metropolitan area. Even more interestingly, it becomes the party most frequently cited as a second choice, at 17%, up three points.
This obviously does not mean that these second choices will automatically turn into votes.
But the result indicates that the PCQ's electoral potential now exceeds its current core.
Most importantly, his vote has become much more geographically concentrated.
It is this change that can transform a national proportion of votes barely higher than that of 2022 into a completely different parliamentary representation.
The PCQ does not need to double its vote to multiply its seats.
He needs to win in the right place.
This distinction may seem trivial. However, it is fundamental in a single-member constituency election.
Conservative voters had the excellent idea, electorally speaking, of being more concentrated in the same constituencies.
The PLQ has its own geographical advantage
The Liberal Party has long benefited from a different mechanism.
His vote remains heavily concentrated in several Montreal ridings, particularly in the west of the island.
It can therefore convert its supporters into seats relatively efficiently without being competitive everywhere in Quebec.
We thus find ourselves with four parties whose provincial results are separated by only about ten points, but whose ability to transform these votes into members of parliament can be radically different.
A party with around 29% can approach a majority.
Another group, with around 22%, can retain a significant delegation.
A third one with around 20% can lose a large part of its own.
A fourth party with around 17% could suddenly start winning a series of constituencies.
These are not calculation errors.
This is our voting method.
The real movement is behind the PQ
This is ultimately what the three polls say.
The PQ is barely rising.
But the countryside is changing around him.
The CAQ is losing ground. The PLQ remains competitive without widening its lead. The PCQ is consolidating its regional presence. Québec solidaire remains further behind.
Meanwhile, Paul St-Pierre Plamondon's leadership indicators are progressing without his party actually exceeding 29%.
This is perhaps the most interesting phenomenon of this end of the campaign.
The leading party doesn't need a wave of support to significantly improve its prospects. It simply needs the four parties behind it to continue dividing up the territory and the electorate.
A few points transferred between the CAQ, the PCQ and the PLQ could therefore change the provincial ranking relatively little while flipping a considerable number of ridings.
At this stage, simply asking "who is at what level?" is no longer sufficient.
You need to ask: Or?
Because on election night, the real story might not be the percentage obtained by each party.
This could be the dramatic gap between the votes that Quebecers will have cast and the National Assembly that those votes will have produced.
Sources: Segma Research; Pallas Data; Léger; Qc125; Quebec Elections.
About the Author