

Quebec likes to tell itself that it is a unique model.
We have our social model, our institutions, our programs, our state-owned enterprises, and a conception of the role of the state that distinguishes us from the rest of the continent.
Alright.
But a business model should not be judged on its intentions.
He should be judged on his results.
For twenty years, I have criticized certain aspects of the Quebec model, relying primarily on statistics. Not because I take pleasure in denigrating Quebec, but for the exact opposite reason: I am convinced that we could do much better.
Quebec has many advantages: an educated population, considerable natural resources, an enviable abundance of energy, developed infrastructure and a privileged position within the North American market.
We are not a poor society condemned by geography or history.
So why are our economic performances so often disappointing?
The mirror problem
Quebecers are used to comparing their economy to that of other Canadian provinces.
Ontario is regularly used as a benchmark. Alberta comes up when discussing wealth or taxation. The Atlantic provinces sometimes surface when we need reassurance.
These comparisons are legitimate.
But they are incomplete.
Quebec is part of a vast North American market where capital, workers, businesses, technologies and goods circulate.
On the other side of the border are fifty American states that also have to finance their infrastructure, attract investment, train their workforce, raise taxes and provide public services.
Why not compare ourselves to them as well?
This is what the database created for Nord Libre / True North allows: the 50 American states and the 10 Canadian provinces, studied through a series of harmonized economic indicators as rigorously as the sources allow.
Sixty jurisdictions.
And a very simple question:
Where does Quebec actually stand among them?
Before the solutions, the diagnosis
The exercise is not about creating an arbitrary index that would crown a winner and designate a loser.
We examine separately growth, standard of living, productivity, labor market, demographics, public finances, debt and certain institutional indicators.
Some results are favorable to Quebec.
Others much less so.
This is precisely how an honest analysis should work.
A company that wants to improve its performance must first accept the possibility that the diagnosis is wrong.
Loving Quebec shouldn't mean telling it that it's doing wonderfully. It should mean wanting it to fully realize its potential.
Some methodological precautions
Comparing Canadian provinces to American states is not as simple as lining up their statistics in a spreadsheet.
Currencies differ. Some statistical definitions differ. The boundaries of provincial, state, and local governments do not always perfectly align.
We therefore ruled out comparisons that might give a false impression of accuracy.
For example, it would be misleading to directly compare a GDP per capita expressed in Canadian dollars in Quebec to a GDP per capita expressed in US dollars in Texas without making the necessary adjustments.
However, we can make a much more robust comparison of growth rates, development indices, ratios relative to GDP, unemployment, migration, demographics, and certain institutional indicators.
A slightly less spectacular but defensible figure is better than an impressive ranking built on apples, oranges and an exchange rate forgotten in a drawer.
Why 2007-2024?
The period 2007-2024 was not chosen to benefit or disadvantage Quebec.
It corresponds to the longest and sufficiently consistent common window available in our database for the main indicators selected.
Our project initially aimed for a longer period. However, the availability of the series, methodological changes, and certain differences between Canadian and American sources made it impossible to maintain the same degree of comparability for all 60 jurisdictions.
We therefore applied a simple rule:
retain the common period that the data allows to be properly compared rather than selecting years on a case-by-case basis.
When certain series, particularly those of theEconomic Freedom of North AmericaIf they stop earlier, we use the latest available year and explicitly state this.
The period was therefore not chosen because it told the story we wanted to hear.
This is the story that comparable data honestly allows us to tell.
An economy that is growing faster than the standard of living
Between 2007 and 2024, Quebec's real GDP increased by approximately 33.4%.
This puts Quebec in the 28th out of 60.
At first glance, nothing catastrophic. We are near the middle of the North American pack.
But when you take the population into account, the picture changes.
Over the same period, real GDP per capita progressed by only about 14.1%.
Quebec then falls into 41st out of 60.
This is one of the most important results of this analysis.
An economy can grow because it has more inhabitants. This does not necessarily mean that everyone becomes much more prosperous.
The contrast with some jurisdictions is considerable. Over the same period, real GDP per capita increased by approximately 59.6% in North Dakota, 44.6% in Washington State, 40.2% in California and moreover 31% in Texas.
In Quebec: 14.1%.
Our economy has grown.
Our standard of living per capita is much lower.
Productivity: the problem is becoming more serious
Between 2007 and 2024, Quebec's labour productivity index increased by only about 13.9%.
This puts Quebec in the 48th out of 60.
We are currently in the bottom fifth of the rankings.
During the same period, Washington State increased its productivity by more than 68%North Dakota, by more than 66%, New Mexico and Nebraska by about 49%and California by more than 48%.
These economies are obviously not identical to that of Quebec.
But when a large number of jurisdictions with very different structures improve their productivity faster than we have for almost two decades, the difference is worth examining.
Productivity is not an esoteric statistic.
In the long term, it is one of the major drivers of rising real wages and living standards.
Wealth can be redistributed in a thousand ways.
But first, you have to produce it.
And now, productivity has plateaued.
The recent trend adds another dimension to the problem.
The productivity surge observed in 2020 should be interpreted with caution. The pandemic has profoundly altered the composition of employment and the number of hours worked.
But even after this anomaly, the trend remains worrying.
Quebec's productivity index was approximately 114.5 in 2021.
He was from 113.9 in 2024.
Virtually no net progress in three years.
Meanwhile, the population is increasing rapidly.
This results in a peculiar combination: we add workers and consumers, and the total economy grows, but the value produced per unit of labor barely increases.
An economy can grow by adding workers. A society becomes richer by making those workers more productive.
2024: The Quebec paradox in miniature
In 2024, Quebec's real GDP increased by approximately 1.7%.
47th out of 60.
However, real GDP per capita has declined by approximately 0.26%.
54th out of 60.
During the same year, Quebec ranked 10th out of 60 for population growth And 11th for net migration relative to population.
We attract people.
Our population is increasing.
Our overall economy is growing.
But the wealth produced by no one is struggling to keep up.
This is probably the best summary of the problem.
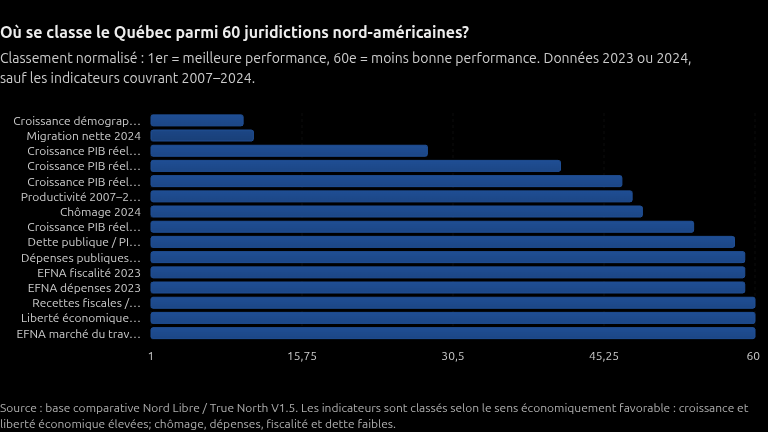
Quebec among the 60 jurisdictions
| Indicator | Period | Quebec | Rank |
|---|---|---|---|
| Population growth | 2024 | +2.0% | 10th / 60 |
| Net migration / 1,000 inhabitants | 2024 | 19.7 | 11th / 60 |
| Total real GDP growth | 2007-2024 | +33.4% | 28th / 60 |
| Growth of real GDP per capita | 2007-2024 | +14.1% | 41st / 60 |
| Real GDP growth | 2024 | +1.7% | 47th / 60 |
| Work productivity | 2007-2024 | +13.9% | 48th / 60 |
| Unemployment | 2024 | 5.3% | 49th / 60 |
| Growth of real GDP per capita | 2024 | -0.26% | 54th / 60 |
| Public debt / GDP | 2024 | 49.8% | 58th / 60 |
| Public spending / GDP | 2024 | 33.7% | 59th / 60 |
| Tax revenues / GDP | 2024 | 20.2% | 60th / 60 |
Source: comparative database Nord Libre / True North V1.5. For variables where a lower value is sought in the ranking, notably unemployment, debt, taxation and public spending, the rank has been uniformly oriented: 1st represents the lowest value.
Is Quebec really lacking in revenue?
This is where public finances come into the equation.
In 2024, tax revenues represent approximately 20.2% of Quebec's GDP.
In our comparison, this is the highest proportion of the 60 jurisdictions.
Public spending represents approximately 33.7% of GDP.
Only one jurisdiction in our sample shows a higher proportion.
These figures do not demonstrate that every dollar spent is useless, nor that a specific level of taxation would be optimal.
However, they show that Quebec hardly fits the picture of a jurisdiction where the state simply lacks resources because it collects or spends little.
The question then becomes:
What do we receive in return for the resources already mobilized?
An ambitious social safety net
One thing must be acknowledged about the Quebec model: we have made ambitious collective choices.
Heavily subsidized childcare, family programs, drug insurance, income support, and widely accessible public services are part of this model.
The economic question is not simply whether these programs are desirable.
It also involves determining whether they can be financed sustainably.
This necessitates separating two questions:
What services do we want?
And
Are we creating enough wealth to finance them?
It's not the same thing.
The problem arises when public commitments grow steadily faster than the economic capacity that must support them.
We can compensate for a certain amount of time by increasing withdrawals.
Part of the bill can also be deferred through debt.
But none of these mechanisms can sustainably replace wealth creation.
Debt: a bill sent back in time
Public debt is often reduced to a line item in the accounts.
But it represents an obligation on future resources.
Interest payments must be made. Bonds must be refinanced or redeemed. The resources allocated to these operations cannot simultaneously fund other priorities.
This does not mean that all debt is bad.
A generation can legitimately borrow to build sustainable infrastructure that will also benefit future generations who contribute to its financing.
In this case, she is transferring a debt. and an asset.
The issue becomes more delicate when debt is used primarily to finance current expenses or to postpone decisions.
We are therefore consuming today a portion of tomorrow's tax revenue.
And what about sustainable development?
Quebec talks a lot about sustainable development.
The principle is simple: one generation should not unnecessarily compromise the opportunities available to subsequent generations.
Why limit this reasoning to natural resources?
A company can also pass on weakened tax capacity, deteriorated infrastructure and considerable financial commitments.
The right question, therefore, is not simply:
How much do we owe?
But also :
What have we created with this debt?
And will the generations who will have to bear the cost receive a corresponding economic inheritance?
The tax wall is not necessarily a wall
The expression evokes a sudden catastrophe.
The reality is generally less spectacular and, precisely for that reason, easier to ignore.
A budgetary situation can deteriorate gradually: recurring deficits, heavier debt service, postponed investments, additional taxes or tariffs, then a gradual reduction of room for maneuver.
The real risk is therefore less a sudden bankruptcy than a progressive erosion of the capacity to act.
This is what makes the combination observed in Quebec worthy of attention: high spending, high taxation, significant debt and relatively low growth in productivity and GDP per capita.
Different political responses
The main parties are currently proposing different responses to this situation.
THE Liberal Party of Quebec It anticipates a return to balance in 2029-2030 and emphasizes improving government efficiency, some reallocations, and new investments. Its framework includes nearly billion in new commitments.
Quebec solidaire also aims for balance in 2029-2030, but proposes in particular to increase state revenues through a tax on fortunes exceeding million, which the party estimates could generate billion per year, in order to finance its priorities.
THE Conservative Party of Quebec It proposes instead a larger reduction in the spending trajectory, with billion in savings announced over five years, combined with tax cuts and a return to balance planned for 2029-2030.
These frameworks are therefore not based on the same diagnosis or the same instruments.
Our comparison of the 60 jurisdictions obviously does not allow us to determine on its own which policy should be adopted.
However, it helps to situate the economic problem that these different proposals attempt to address.
Economic freedom: another piece of the picture
Our database also includes indices from theEconomic Freedom of North America.
These indices do not measure the quality of a society nor directly its prosperity. They measure certain institutional characteristics related in particular to public spending, taxation and the labor market.
In 2023, Quebec was located:
- 60th out of 60 for the subnational index;
- 60th out of 60 for the labor market;
- 59th out of 60 for taxation;
- 59th out of 60 for expenses;
- 56th out of 60 for the index taking into account all levels of government.
A word of caution: the subnational index is particularly useful for comparing jurisdictions within the same country. For Canada-United States comparisons, the index that includes all levels of government is a more appropriate benchmark.
These results do not demonstrate that greater economic freedom automatically leads to higher growth.
They nevertheless add another piece to the institutional portrait of Quebec.
The real problem: creating more wealth
The result that should probably hold our most attention remains this one:
Real GDP per capita: +14.1% in seventeen years, 41st out of 60.
Productivity: +13.9%, 48th out of 60.
And productivity now seems almost stagnant.
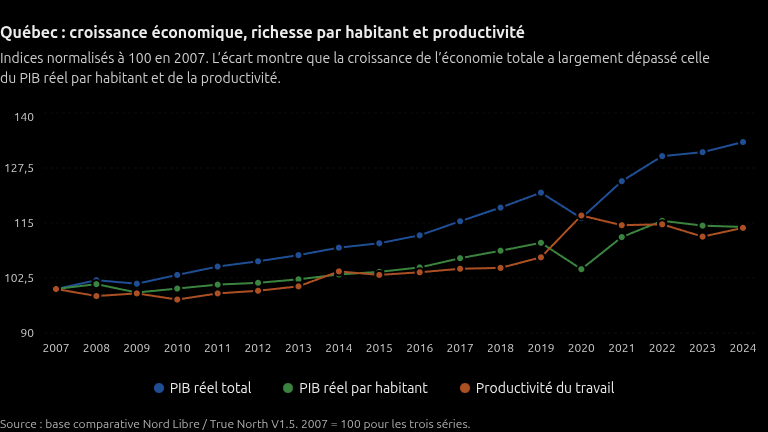
The overall economy increased by 33.4% since 2007.
GDP per capita, of only 14.1%.
Productivity, of 13.9%.
This is probably the graph that best tells our recent economic story.
Quebec has grown much larger much faster than it has become more productive.
But a government can move money, tax, subsidize, borrow and redistribute.
He cannot decree a lasting increase in prosperity.
In the long run, a society becomes richer when it succeeds in producing more value with its labor, capital, knowledge, and resources.
A more productive economy also broadens the tax base without the need to constantly increase rates.
Here's another way to "give yourself the means".
To create more wealth.
The cake before the slices
The debate in Quebec focuses heavily on distribution.
Who should pay more?
Who should receive more?
Which program should be improved?
Which activities should be taxed or subsidized?
These are sometimes necessary questions.
But they all focus on how to share wealth.
Far fewer discussions focus on the preliminary question:
How can we produce more of it?
The way you cut the cake can be perfected indefinitely.
If it grows more slowly than that of our neighbors, the discussion about shares eventually becomes increasingly difficult.
Wealth creation is therefore not the opposite of social ambitions.
It constitutes its material condition.
A productive economy is needed to finance schools, hospitals, infrastructure, and support for vulnerable people.
Before wealth can be redistributed, it must first be created.
None of this is inevitable.
The objection is predictable: Quebec is different.
It's true.
But Texas is different from Vermont. California from North Dakota. Alberta from Nova Scotia. Washington from Tennessee.
The 60 jurisdictions studied have very different industrial, demographic and institutional structures.
This rules out simplistic explanations.
But this also makes it difficult to attribute all our results to an inevitable Quebec peculiarity.
Quebec has considerable natural resources, significant hydroelectric production, universities, an educated workforce and direct access to the North American market.
The potential exists.
The question is how to better convert it into productivity and standard of living.
This observation directly relates to two reports already published here: The Quebec model: what if Duhaime was right about the diagnosis? And Prosperity before independence.
Looking at Quebec as it is
So, where does the Quebec economy really rank in North America?
The portrait is contrasting.
Quebec attracts people.
Its population is growing rapidly.
Its overall economy continues to grow.
But its GDP per capita is growing much less rapidly.
Its productivity is in the bottom fifth of our ranking over the entire period and appears to have plateaued recently.
At the same time, Quebec is near the upper end of our sample in terms of the weight of tax revenues and public spending, and among the most indebted jurisdictions according to the harmonized measure used.
This is not a portrait of a society without qualities.
This is a portrait of a society that possesses significant assets but does not transform them as effectively as it could into growth in productivity and living standards.
That is precisely why these figures deserve to be looked at.
I am not criticizing Quebec because I want to see it fail.
I criticize him because I refuse to believe that his current performances represent all that he is capable of.
We have the resources.
We have the human capital.
We have the energy.
We have access to the North American market.
We have the potential.
And no economic ranking is inevitable.
The first step is simply to look at the results as they are.
Because you can't correct a trajectory that you first refuse to measure.
And before deciding how to turn the steering wheel, you still have to accept looking at the road.
About the Author




1 thought on “Quebec's economy: where does it really rank in North America?“