

For decades, Quebec has opted for a more prominent state than most North American jurisdictions. Increased public spending, higher taxes, more extensive public services, and significant government intervention in the economy are integral to this. Quebec model.
The question is not whether the state is useful. It is. No modern market functions without security, justice, infrastructure, protection of property rights, and stable institutions.
The real question is this:
Is there a size of state beyond which its expansion ceases to promote prosperity and instead begins to harm it?
This is precisely the hypothesis behind what is called the Armey curve.
Thanks to our comparative database of 50 American states and 10 Canadian provinces, we can now begin to test this hypothesis with North American data rather than with intuitions.
In short
- In the 50 US states, the estimated turning point is generally around 25 to 29% of GDP in public spending.
- Beyond this zone, higher expenses are associated with a weaker future growth.
- Productivity and high taxation generally send signals in the same direction.
- Quebec is located approximately 33.7% of GDP in public spending, above this reference zone.
Neither zero state, nor a state without limits
The idea behind the Armey curve is simple.
When the state is almost non-existent, its initial expansion can foster growth. A functioning judicial system, basic infrastructure, public safety, and contract protection create a more favorable environment for investment, trade, and production.
But there is no reason to believe that this positive effect will continue indefinitely.
As the state grows, its financing requires more taxes or debt. The resources it mobilizes are no longer available for other uses, while regulations and public choices can alter the incentives to invest, work, or start a business.
In Armey's hypothesis, the marginal benefits of state expansion eventually decrease while its marginal costs increase. The theoretical relationship then takes the form of a bell curve: growth initially increases with state size, reaches a maximum, and then slows down. This relationship has been the subject of numerous empirical estimations, with thresholds that vary according to the country, the period, and the methods used.
The easy part is drawing the curve.
The interesting part is verifying whether it actually exists in the data.
Start with the data, not the conclusion
It would have been easy to start with an ideological conviction and then look for the regression that confirms it.
It's an excellent way to win a conversation with yourself.
Our database primarily covers the period 2007 to 2024 and includes in particular public spending, tax revenues, real GDP per capita, public debt, labour productivity, demographics and unemployment.
Government spending as a proportion of GDP is our main measure of the size of the state.
We then compared this variable to future economic growth over several time horizons rather than to growth in the same year.
This distinction is essential.
During a recession, GDP can decline while government spending remains stable or increases. The spending-to-GDP ratio then mechanically rises. A simplistic regression model might therefore conclude that spending causes poor growth when it is merely measuring the government's response to an unfavorable economic situation.
We therefore used lagged variables, growth horizons of several years and different specifications in order to reduce this problem.
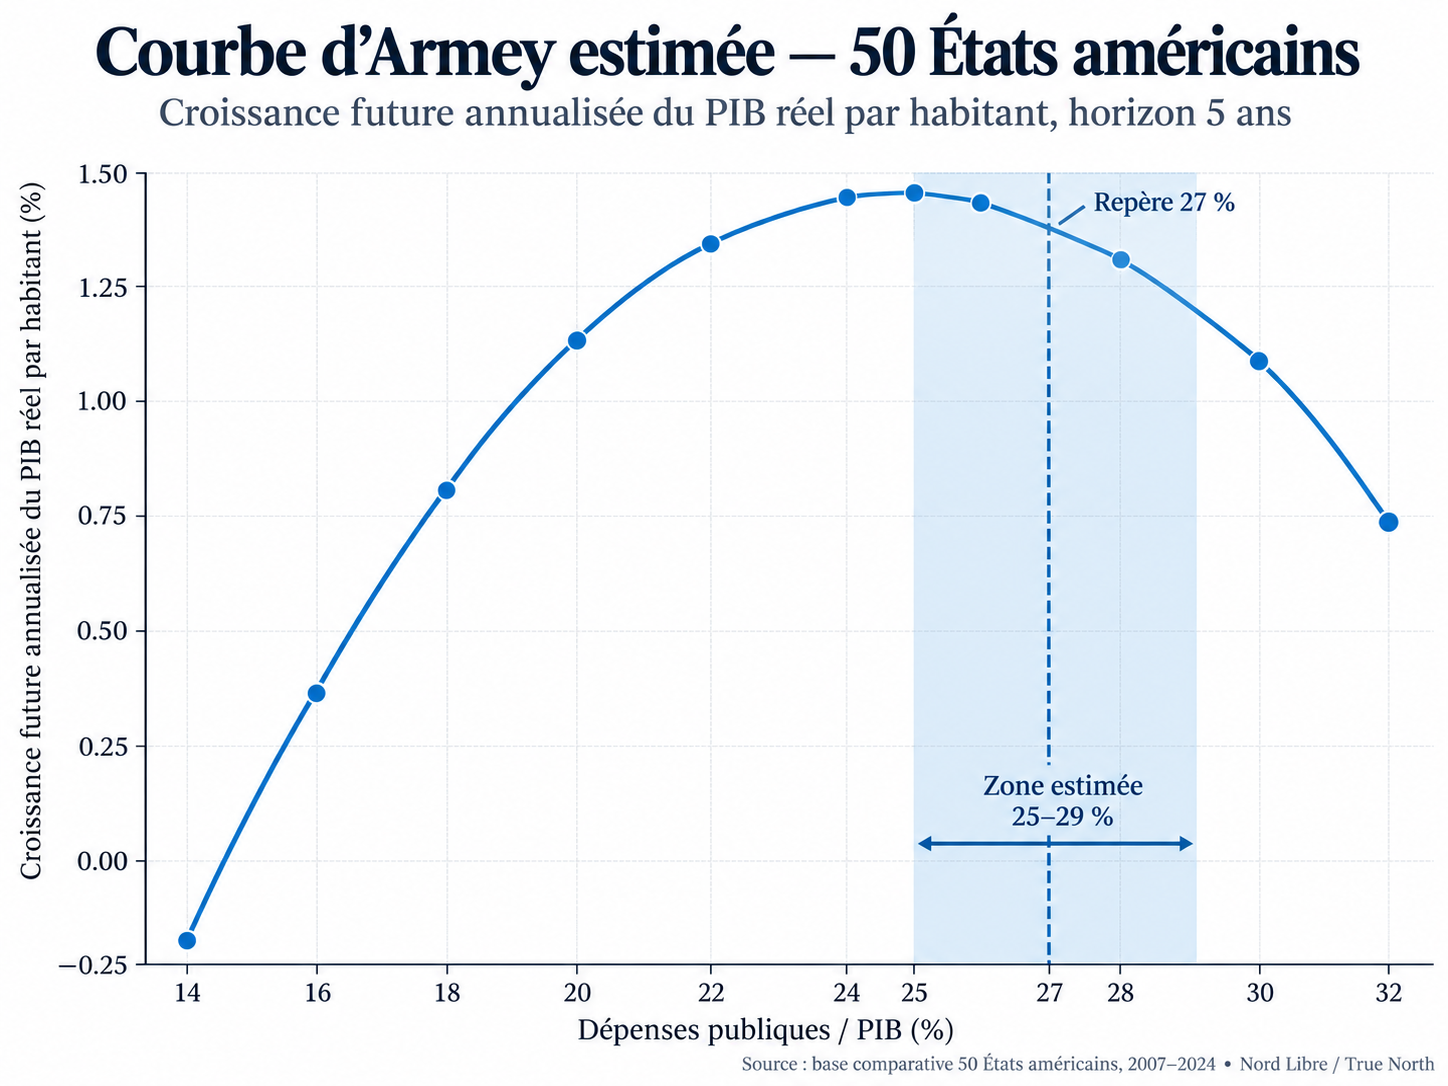
A turning point zone around 25 to 29%
It's on the side of the 50 US states that the result is the clearest.
Depending on the specifications used, the estimated peak of the curve is usually located between approximately 25 and 29% of GDP in public spending.
Over a five-year growth horizon, one of our key specifications places the turning point around 25%Over ten years, the estimate remains in a similar range.
When we add controls for unemployment, demographics, or public debt, the peak moves relatively little.
This does not mean that we have discovered a universal constant called "26.734%". Economics rarely has the finesse to operate with that kind of precision.
Our results indicate rather a turning zoneBelow this threshold, government expansion can still be compatible with better economic performance. Above it, returns appear to begin to decline.
The fork 25 to 29% of GDP is therefore much more defensible than a magic number.
What happens beyond the summit?
A beautiful curve is not enough.
So we asked a second question: Once a jurisdiction crosses this threshold, is there actually a deterioration in future performance?
Using approximately 27% of GDP As a central point, the American result becomes particularly interesting.
Above this threshold, each additional increase in the burden of public spending is associated with a weaker future growth of real GDP per capita.
The result remains the same when controls for unemployment, population growth, and debt are added.
In other words, the result is not based solely on a parabola drawn on a scatter plot. The expected economic behavior also emerges when future performance is examined directly.
Productivity is moving in the same direction.
Productivity is probably even more important than gross growth.
In the long term, a society can only become sustainably richer if it produces more value per worker or per hour worked.
An economy can temporarily mask its structural weaknesses through debt, rapid population growth, or increased public spending. It is much more difficult to mask a prolonged stagnation of its productivity.
However, our analysis also shows a negative relationship between a large state size and future productivity growth.
The statistical signal is weaker than that of real GDP per capita, but it points in the same direction. This is the kind of corroboration one hopes to find if the observed relationship in growth is not simply accidental.
Taxation tells a similar story
We then repeated the exercise, replacing public spending with the tax revenues as a proportion of GDP.
This time, the result is less clean.
We haven't found a sufficiently stable turning point to declare a precise optimal tax level. This level of precision is something the data doesn't provide.
Conversely, at high levels of taxation, the relationship with future performance generally becomes negative.
Higher taxation is associated with lower future growth and productivity. The exact threshold varies more than for spending, but the general trend is the same.
Two different measures of state size thus begin to tell a comparable story.
Where is Quebec located?
This is where the exercise ceases to be abstract.
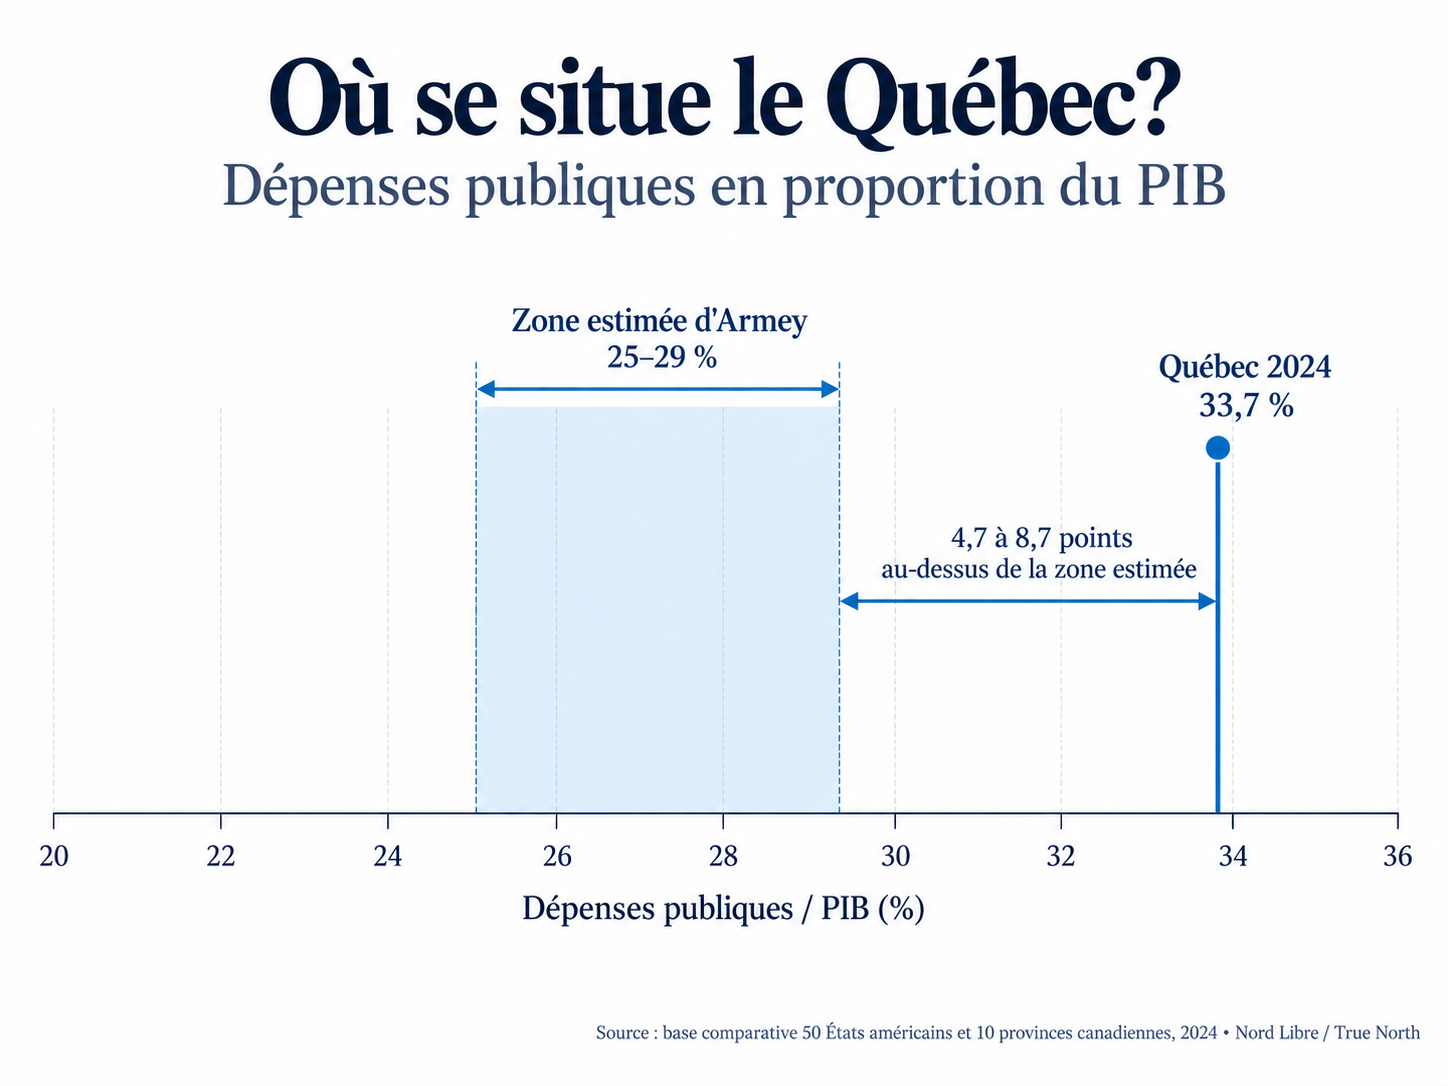
In 2024, according to our comparative basis, Quebec's public spending represents approximately 33.7% of GDP.
This is significantly above the zone of 25 to 29% obtained in the most robust US estimates.
Quebec also ranks very high in terms of taxation, with tax revenues equivalent to approximately 20.2% of GDP.
However, it would be unwise to conclude that Quebec should simply reduce its spending to 27% and wait for prosperity to magically appear.
American and Canadian institutions are not identical. The provinces assume different responsibilities than the American states. Federal transfers, equalization payments, healthcare systems, federal taxation, and the division of powers alter the context.
The American curve therefore does not give us the Quebec optimum.
She gives us a North American point of comparison.
And as such, Quebec's positioning deserves at least some attention, particularly in light of our previous analysis on Quebec's place among 60 North American jurisdictions.
Why is the Canadian signal more fragile?
When we estimate the curve separately for the Canadian provinces, the results become much less stable.
The first explanation is almost embarrassingly simple: we have 10 provinces, against 50 US states.
As soon as lagged variables, five- or ten-year time horizons, and a few controls are used, the number of useful observations decreases rapidly. Statistical power drops with it.
The provinces also operate within a more homogeneous institutional framework than the American states and cover a narrower range of government sizes. Certain specific economies can also significantly influence the results.
A Canadian specification does indeed give a peak around 29%However, the result is not robust enough to establish a Canadian optimum. It is nonetheless interesting that it does not clearly contradict the American zone.
Do policy changes tell the same story?
We also looked at jurisdictions that have significantly changed their tax burden or their spending.
The objective was to verify whether reductions or increases in the size of the state are followed by the changes in economic performance that our hypothesis would predict.
The results are more mixed.
Some periods show that jurisdictions that have reduced their taxes subsequently experience higher growth. Others show that a significant increase in spending precedes lower growth or productivity.
However, these results are sensitive to the period studied and to a few atypical cases.
This is not surprising: changes in the spending/GDP ratio can be caused by a recession, an economic boom, a financial crisis, an energy shock or a demographic change.
This analysis therefore provides partial corroboration, but not stable enough to support the main argument.
What the data actually allows us to say
It would be tempting to summarize the entire exercise with a spectacular statement:
Quebec is less prosperous because its government is too big.
Our results do not allow for such a categorical conclusion.
However, they allow us to put forward a much more serious hypothesis: The relatively large size of the Quebec state provides a plausible explanation for part of its lagging prosperity.
Several independent results converge.
The American Armey curve generally places the turning point around 25 to 29% of GDPBeyond this zone, additional spending is associated with lower future growth. Productivity moves in a similar direction. High tax levels are also associated with less favorable future performance.
And Quebec is clearly above the spending range where these effects appear in our American sample.
None of these results constitutes definitive causal proof taken in isolation. However, their convergence makes the hypothesis serious enough to warrant further investigation.
The cost that is often forgotten: the opportunity cost
The debate on the size of the state is often presented as an opposition between those who want public services and those who do not.
This opposition oversimplifies the real economic issue.
Every dollar used by the state has a opportunity costThis dollar must be taken, borrowed, or withdrawn from another use.
Some public expenditures can generate more value than the resources they mobilize. But Armey's hypothesis raises precisely the question of whether this proposition remains true when the share of the economy controlled by public administrations becomes very high.
The relevant question is therefore not simply:
"Does this government spending produce anything useful?"
but also :
"Does it produce more value than the use we gave up to finance it?"
That's a much higher bar.
Has Quebec passed its peak?
We cannot answer this question with mathematical precision.
But now we can ask the question seriously.
Quebec devotes approximately one-third of its economy to public spending as measured in our database. In U.S. states, economic returns appear to begin deteriorating several percentage points of GDP earlier.
Future growth, productivity, and taxation all tell a story consistent with this hypothesis.
This does not mean that Quebec should replicate the budgetary structure of a particular American state tomorrow morning.
Rather, this means that after decades of asking whether the Quebec state has sufficient resources, another question now deserves to be asked:
What if the current size of the state itself contributes to limiting part of our prosperity?
Prosperity does not depend solely on the resources that the state can mobilize. It also depends on how all of an economy's resources are used, whether public or private.
Methodological note. The results presented here are based on our comparative dataset of 60 North American jurisdictions, primarily for the period 2007–2024. The estimates utilize multiple growth horizons, lagged variables, and controls to mitigate the effects of the business cycle. The U.S. results are significantly more stable than the Canadian estimates, which are based on only ten provinces. The observed relationships should be interpreted as statistical associations consistent with Armey's hypothesis, not as definitive causal proof.
About the Author